Rerun

Turn Your Data Into Charts and Reports

Ask a question in plain words and get the answer from your data: cleaned figures, clear charts, A/B test readouts and a weekly KPI report your team can trust.

Turn Your Data Into Charts and Reports agent board

About

Ask a question about your business and get the answer a good analyst would give: the number, what drove it, the charts and what to do next.

What it does

  • Cleans messy exports and spreadsheets, and lists every fix it made
  • Answers questions in plain language by writing SQL or scripts on your data, with charts
  • Builds dashboards and a weekly KPI report that compares like with like
  • Sizes A/B tests and tells you whether a result is significant and which variant to ship
  • Flags anomalies and outliers with a likely cause to check

What you need

  • Nothing to start: paste a table or share an export, and it can show a sample analysis first
  • Google Sheets (optional) to read and write your spreadsheets, BigQuery (optional) to query your warehouse, Slack (optional) to post reports to your team. Postgres, PostHog, Airtable and other tools in the Rerun catalogue work too

How setup works

You get a first answer with charts in the first minutes. It then learns your metrics and their definitions, connects where your data lives, and confirms the day of the weekly report.

What stays in your hands

  • It reads and queries your data but never changes or deletes source data without your go-ahead
  • Reports are posted to your team only where and when you say

What you will need

  • Google BigQuery

  • Google Sheets

  • Slack

Coworkers in this template

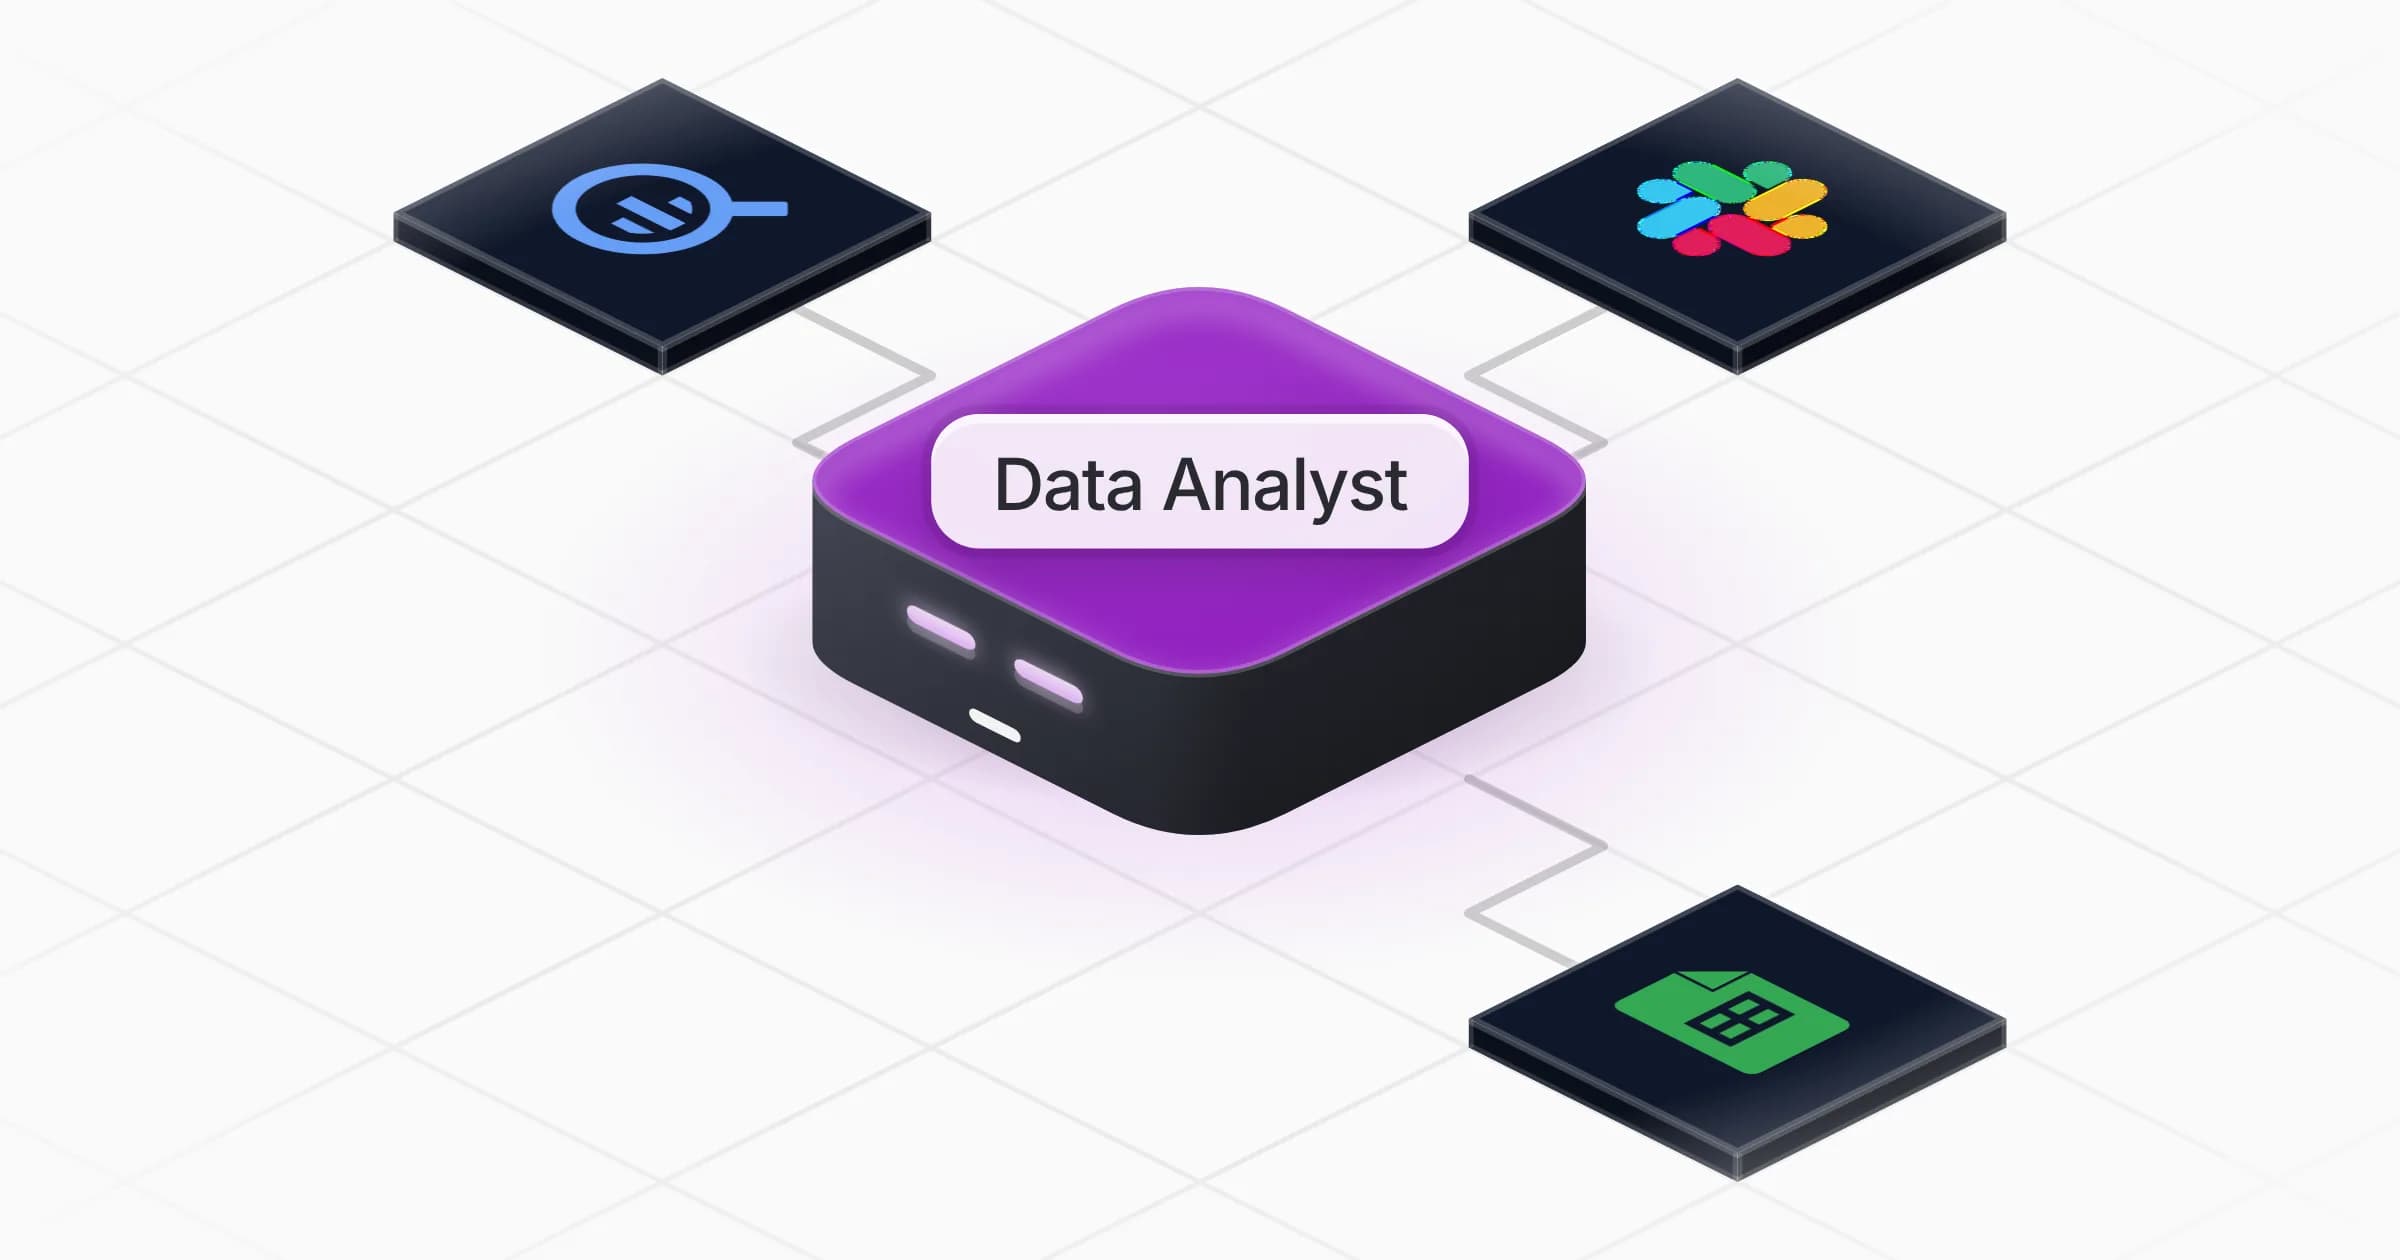
Data Analyst

Answers your business questions from your data with clean numbers, charts and a short report you can share.

Apps

Skills · 6

Answer a data question

Use when asked a question about the business that their data can answer, from an export, a pasted table, a spreadsheet or a warehouse.

Build charts and a dashboard

Use when asked to turn data into charts, a chart pack or a dashboard of the metrics that matter.

Clean a dataset

Use when asked to clean, fix or prepare a spreadsheet, export or data feed before it is analysed.

Flag data anomalies

Use when asked to spot outliers, anomalies or anything that looks wrong in a dataset or a metric.

+2 more

Scheduled tasks · 1

Weekly KPI report

At 09:00 AM, only on Monday
Frequently asked questions

What data can it analyse?

CSV and Excel exports, tables pasted in the chat, Google Sheets and BigQuery once connected, and other sources in the Rerun catalogue such as Postgres, PostHog or Airtable.

Can I ask questions about my data in plain English?

Yes. It looks at your schema, writes the SQL or script, runs it and answers with the figure, a chart and the query it used so you can check it.

Can it tell me if my A/B test is significant?

Yes. Give it visitors and conversions per variant and it reports the difference, confidence interval and significance, checks for common traps and recommends ship, keep running or stop. It can also size a test before you launch it.

Will it change my spreadsheet or database?

No. It reads and queries your data. Cleaned data is written back only to the place you choose, after your go-ahead.

Can it send a weekly report to Slack?

Yes. It prepares a weekly KPI report on the metrics you agree on and posts it to the Slack channel you pick, once you have approved it.

How much does it cost to run?

The template is free. Runs, including the weekly report, use your Rerun credit.

2,000+ businesses run on Rerun

Hire Coworkers on the ChatGPTplan you already pay for.

  • 1. Plug in your subscription
  • 2. Set up your Coworkers
  • 3. Run your business with Coworkers