AI Agent Observability: Monitor and Debug in Real Time
Most AI agents fail not because they were built wrong, but because no one could see what was happening. Here is how AI agent observability helps you monitor, trace, and debug in real time before a silent failure becomes a production incident.
Gartner predicts 40% of agentic AI projects will fail by 2027. Meanwhile, only 11% of enterprises have successfully moved AI agents from pilot to production, according to the Menlo Ventures 2025 AI Report.
That gap is not a strategy problem. It is a visibility problem.
When an agent breaks in production, you need to know exactly what it did, in what order, and why. Without observability, a failed run is a silent mystery. With it, you have a log, a trace, and a dashboard that tells you precisely where things went sideways.
This guide covers what AI agent observability actually means, the four things you need to monitor, the most common failure patterns, and how Rerun handles all of it live, by default, with no instrumentation setup.
In a hurry? Spin up your first observable agent and watch it work live.
What Is AI Agent Observability?
Observability, in traditional software, means being able to answer: "What is my system doing, and why?" You instrument your code, collect metrics, and read logs.
AI agent observability asks the same question, but the system is fundamentally different. An agent does not follow a fixed code path. It reasons, decides, and acts. Each run is shaped by the model's output at that moment, the tools it chose to call, and the data it encountered along the way.
So observability for AI agents means tracking:
- What the agent decided to do (reasoning steps and tool selections)
- What tools it actually called, with inputs and outputs
- How long each step took, and how many tokens it consumed
- Whether it asked for human input, or hit an error and retried
- The final outcome, and whether it matched the intended goal
Without that level of detail, debugging is guesswork.

Why AI Agent Observability Is Not Like Monitoring a Regular API
Traditional APM tools like Datadog, New Relic, or Sentry are built for deterministic systems. They catch exceptions, measure latency, and trace requests through predictable code flows.
AI agents are not deterministic. The same prompt can produce different tool calls on different runs. A valid run can still produce a wrong result. An error may not throw an exception at all; it might just be a model that confidently does the wrong thing.
Here is what changes when you move from traditional monitoring to AI agent observability:
| Dimension | Traditional Software | AI Agent |
|---|---|---|
| Execution path | Fixed, deterministic | Dynamic, model-driven |
| Error signal | Exceptions, 4xx/5xx codes | Silent wrong outputs |
| Debug unit | Stack trace | Reasoning trace + tool calls |
| Retry logic | Network-level retries | Model-level self-correction |
| Key performance metric | Latency and throughput | Tokens, cost, tool call count |
| Human-in-the-loop | Rare, for exceptions only | First-class design feature |
A standard APM tool will not tell you that your agent called the wrong tool, hallucinated a field name, or burned three times the expected tokens because it got confused on step four.
The Four Pillars of AI Agent Observability
1. Traces: The Full Action Log
A trace is the complete, ordered record of everything an agent did during a single run. Every tool call, every model response, every decision branch. This is the primary artifact for debugging.
A good trace shows you the exact prompt sent to the model at each step, the model's tool selection and reasoning, the tool inputs and outputs, and any retries or error recovery attempts.
Here is what a single trace entry looks like:
{
  "run_id": "run_9x7k2m",
  "agent": "margo",
  "step": 3,
  "action": "tool_call",
  "tool": "stripe_list_invoices",
  "input": { "customer_id": "cus_Nx4TzAbc", "status": "unpaid" },
  "output": { "invoices": [{ "id": "in_1PxAbc", "amount_due": 2400 }] },
  "tokens": 412,
  "duration_ms": 847
}
Without this, "the agent did not send the invoice" is a complaint. With this, it is a diagnosis.
2. Logs: Structured, Searchable, Timestamped
Logs are the searchable layer on top of traces. You want them structured, not raw text, with timestamps, token counts, and run IDs so you can filter by agent, time range, or failure type.
Good logs answer questions like: "Show me all runs where the email tool was called more than twice" or "Find runs from this week that ended in error."
3. Metrics: Cost, Speed, and Health at a Glance
Metrics are the aggregates you monitor over time to catch slow degradation before it becomes a hard failure:
- Total cost per agent per day (token costs compound fast at scale)
- Average run duration (spikes often mean the agent is confused and retrying)
- Error rate (rising errors are usually a leading indicator of complete failure)
- Human escalation rate (more escalations than usual is a behavioral signal)
4. Human-in-the-Loop Visibility
This pillar is often underestimated. A well-designed agent knows when to pause and ask. Observability means you can see those moments, track how often they happen, and understand whether your agents are appropriately confident or chronically uncertain.
If an agent escalates 80% of its runs to a human, it is not confident enough. If it never escalates, check whether it should be.
 Agentic AI Production Gap: Only 11% Deployment Despite 38% Enterprise Pilots as Gartner Predicts 40% Failure Rate - HumansAreObsolete.comEnterprise agentic AI faces massive production deployment gap as only 11% of organizations successfully deploy autonomous agents despite 38% running pilots. Gartner warns 40% of agentic projects will fail by 2027, exposing challenges in scaling AI agents for real-world business operations.
Key Metrics to Track for Every AI Agent
Use this checklist to set up your observability baseline for any new agent:
The first six are table stakes. The last three take more setup but surface the most about long-term agent health.
What Goes Wrong: The Most Common AI Agent Failure Patterns
Knowing what to monitor is easier once you know what breaks. These are the failure modes that observability catches early.
Tool call loops. The agent calls the same tool repeatedly, either because the output was not what it expected or because it lost track of state. Without logs, this looks like a slow run. With logs, you see fourteen identical tool calls in ninety seconds.
Context overflow. When a long conversation or a large tool output pushes the agent past its context window, the model starts forgetting earlier steps. The agent continues, but degrades silently. Metrics flag this as a sudden increase in run duration and token cost.
Silent wrong outputs. The agent finishes successfully but produces an incorrect result. No exception is thrown. Traditional monitoring marks this run as healthy. Only semantic validation or human review catches it.
Confidence hallucination. The model fills in a missing value with something plausible but false. Without a trace showing the model's reasoning at that step, there is no way to know it happened.
Escalation fatigue. The agent asks for human input so often that operators start auto-approving without reviewing. Tracking escalation rate and response quality over time surfaces this pattern before it becomes a liability.
"The most dangerous AI agent failure is the one that looks like a success. Observability is the only way to tell the difference."
How Rerun Handles Agent Observability
Rerun is built around a single idea: AI agents should be visible. Not observable via a third-party tool you bolt on after the fact, but visible by default, live, as they work.
Every agent on Rerun runs on its own dedicated machine. Every action it takes is logged automatically, with timestamps, token counts, and tool inputs and outputs. You do not configure logging. You open the builder view and read the log.
Builder View: Logs
The Logs tab shows every action the agent took, in order, with elapsed time, tokens used, and the tool that was called. It updates in real time as the agent works.
You can watch an agent read an email, look up a contact, call the CRM tool, compose a reply, and send it, one step at a time, as it happens.
To Handle: Pending Approvals and Questions
The "To Handle" tab is your escalation inbox. Any time the agent pauses to ask a question or request approval, it shows up there. You approve from the app or from Slack, and the agent resumes exactly where it left off.
Monitoring: 24h / 7d / 30d / 90d Dashboards
The Monitoring section shows cost, run count, and token usage over configurable time windows. Set it to 7d for your weekly cost at a glance. Set it to 90d and you see trends that a single-run view would never surface.
Live Dashboards: Watching Multiple Agents at Once
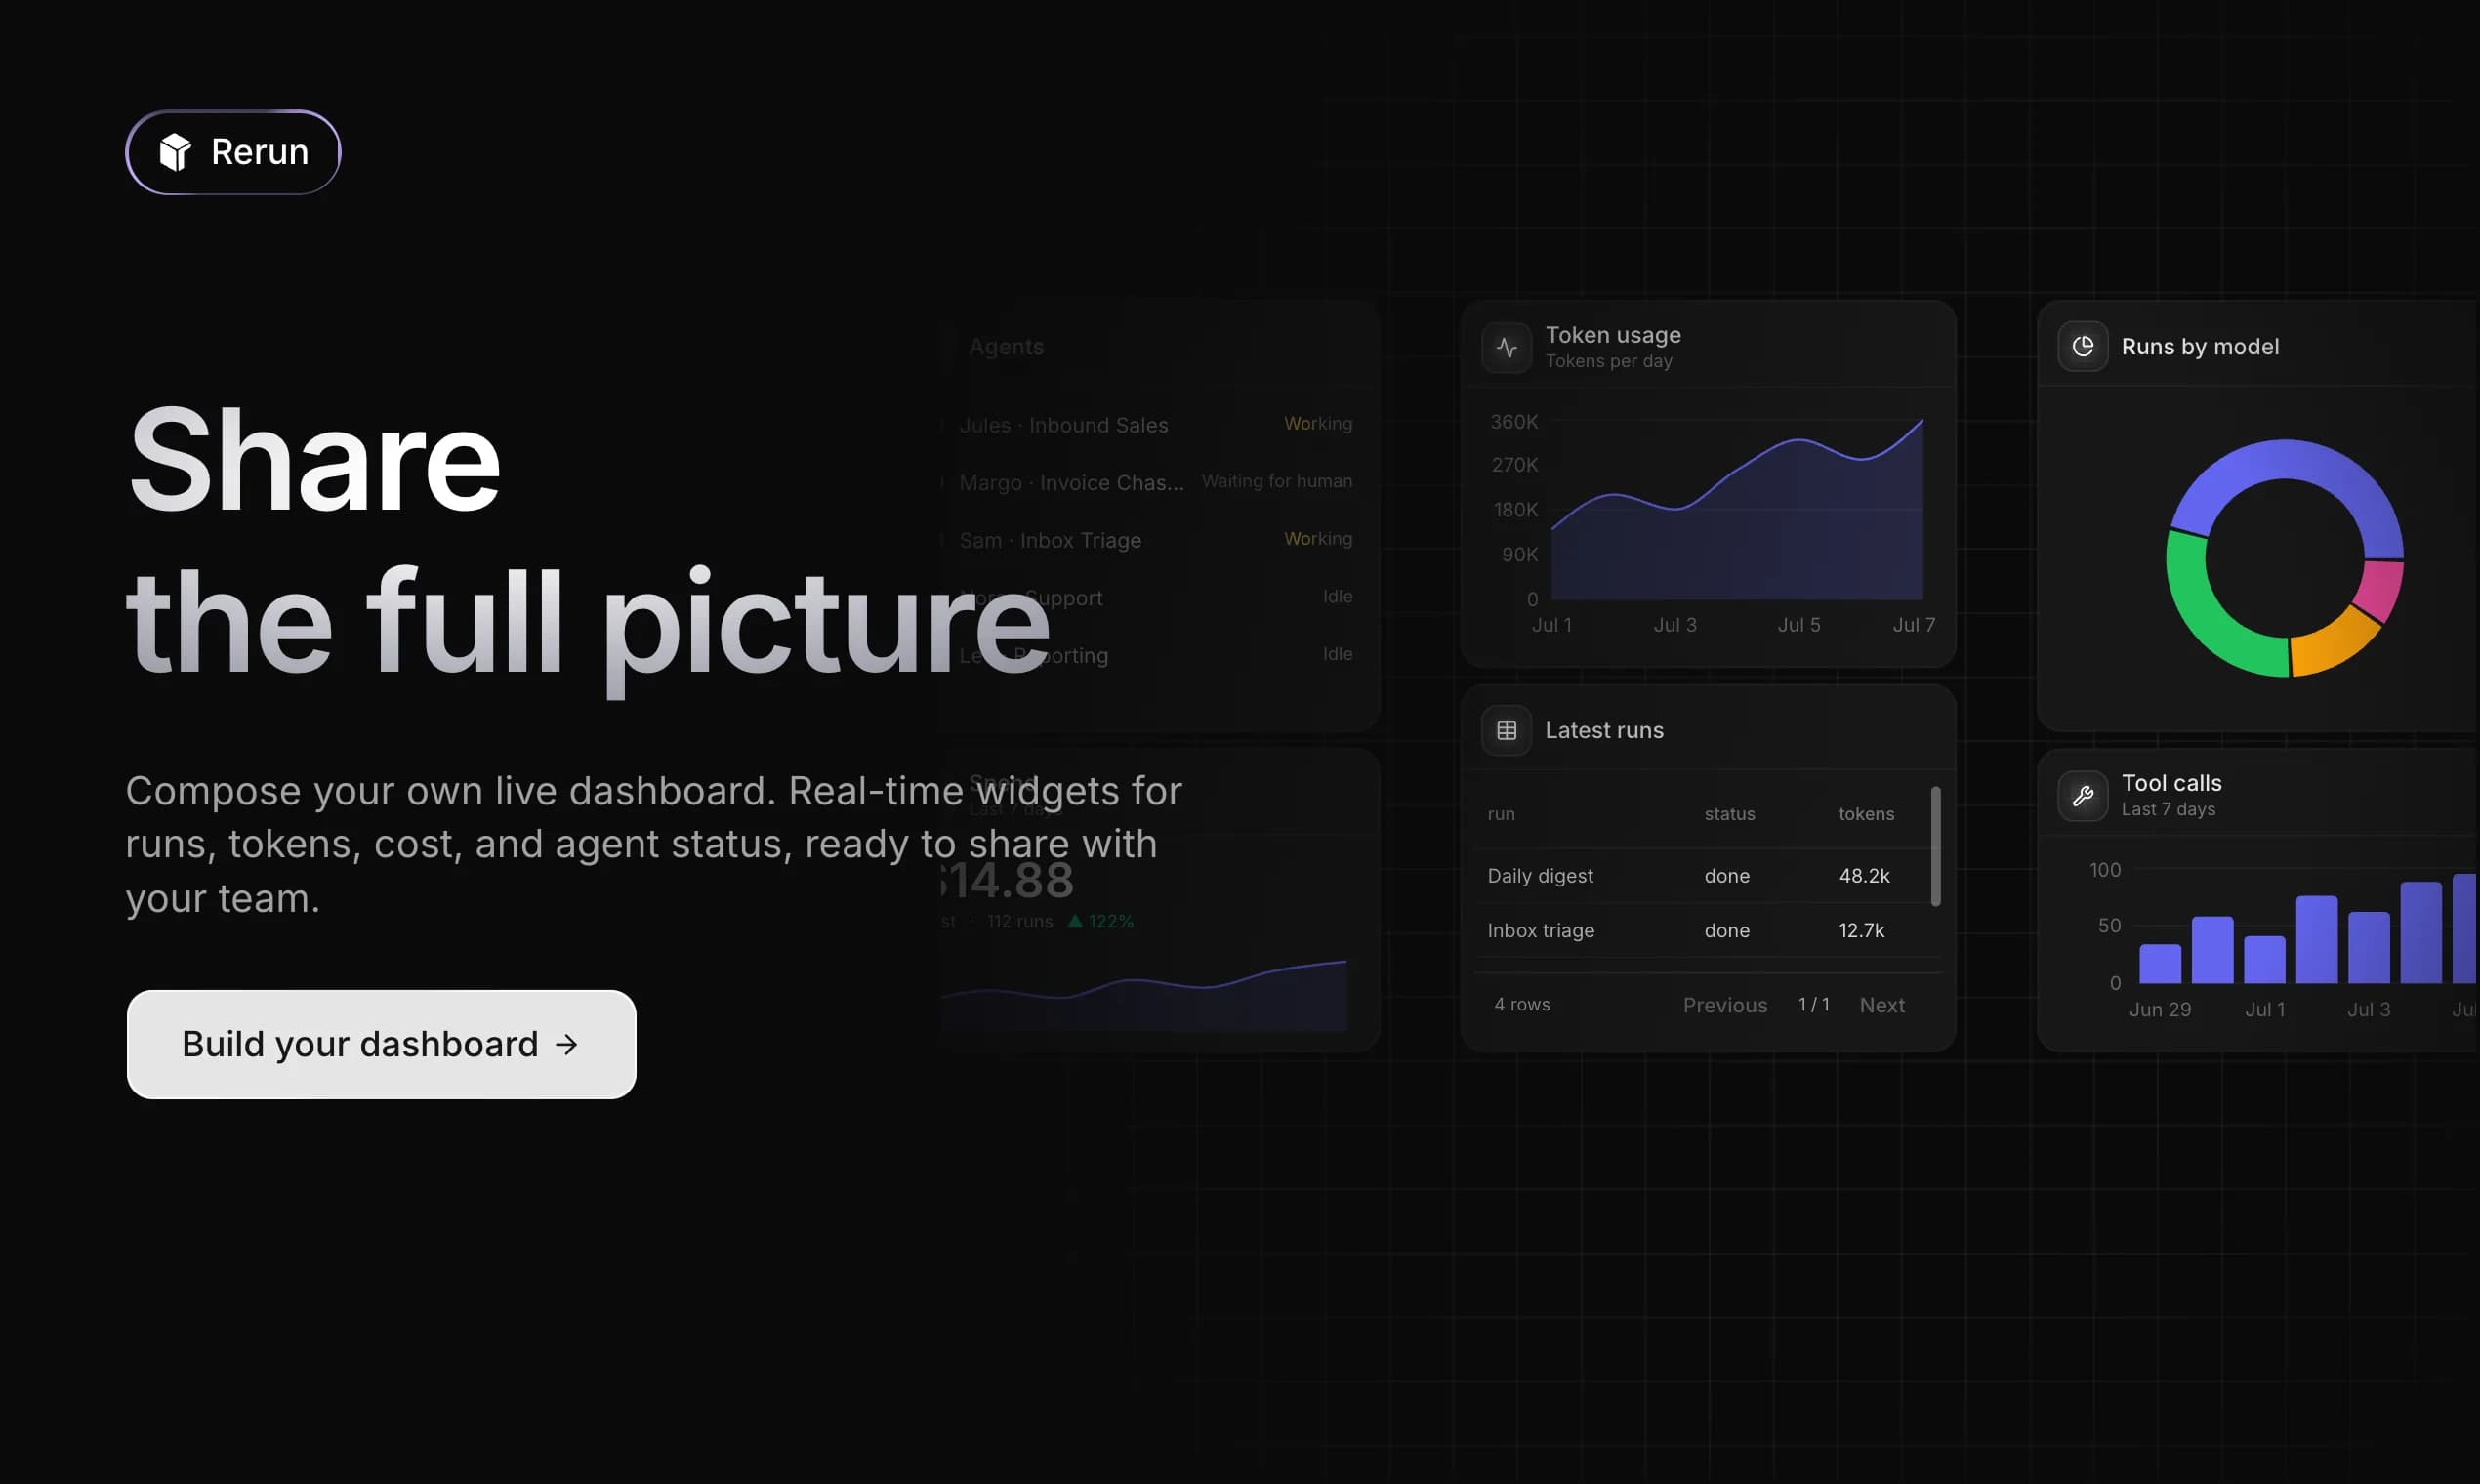
Single-agent observability is useful. Multi-agent observability is where Rerun's dashboard system becomes genuinely powerful.
You build a custom page with widgets that pull live data from any of your agents:
- Agent Status widget: who is idle, working, in error, or waiting for a human
- Token Usage widget: cost per agent over time
- Logs widget: a live feed of actions across all agents
- Analytics widget: aggregated performance metrics
- To Handle widget: all pending escalations across the entire workspace
You can publish this page as a public link. Your team lead, a client, or a stakeholder opens a URL and sees exactly what is happening, without needing a Rerun account and without touching the agent configuration.
This is observability that non-engineers can actually use.
If you want to see what a production-grade agent setup looks like before adding observability on top, read our guide to building an AI sales agent with no code.
What Black-Box Agents Cannot Tell You
Most agent platforms are optimized for setup speed. You wire up a flowchart, connect a model, and hit run. When it works, great. When it does not, you get a generic error and a billing line item.
Zapier workflows tell you that a step failed. They do not tell you what the model was reasoning when it made the wrong choice, or why the trigger fired three times instead of once.
Chatbot platforms tell you that a conversation ended without resolution. They do not show you the reasoning trace that led the bot to the wrong answer.
Flowchart-based tools are transparent about the happy path. Edge cases and model decisions remain invisible.
Rerun is different because transparency is the product, not a feature you add later. Every run is a trace. Every trace is readable. Every agent is watchable, live.
{ "goal": "Diagnose why the invoice-chasing agent failed to send a follow-up on run #312", "steps": ["Open the Logs tab for the Margo agent in Rerun", "Filter to run #312 and read the full action sequence", "Identify the step where the tool call failed or produced unexpected output", "Check whether the agent escalated or continued silently", "Review the token usage spike if present", "Propose a fix: update the agent brief or the tool input format"] }Setting Up Observability on Rerun: The Five-Minute Start
If you are running agents on Rerun, observability is already on. Nothing to configure. Here is how to use it well from day one:
Step 1: Open the builder for your agent. Navigate to any agent and click the builder icon. You will see the Logs tab and To Handle tab immediately.
Step 2: Run a task and watch the log. Trigger a run and leave the Logs tab open. Watch each action appear in real time. Read the tool inputs and outputs. This alone tells you more about your agent than any summary dashboard.
Step 3: Set up your monitoring baseline. In the Monitoring section, set the time window to 7 days. Note your baseline cost and run count. Any significant deviation is worth investigating.
Step 4: Add a To Handle widget to your main dashboard. Add the "To Handle" widget to your primary page. You will never miss an agent waiting on a human.
Step 5: Publish your dashboard. Hit publish and share the link with anyone who needs visibility. They can watch the work happen without any access to the underlying agent setup.
Rerun's free 7-day trial gives you full access to all of this.

Best AI Coding Agents in 2026: GitHub Copilot, Cursor, Devin and More Compared
The definitive 2026 guide to AI coding agents: GitHub Copilot vs Cursor vs Devin vs Devin Desktop vs Amazon Q Developer. Feature matrix, real pricing, and what comes after the code.
Conclusion: Visibility Is the Missing Layer
Gartner's 40% failure prediction is not a warning about AI capability. It is a warning about AI without visibility. Every failure mode covered in this article, from tool loops to silent wrong outputs to escalation fatigue, is catchable with the right observability setup. Most of them are invisible without it.
Rerun gives you that visibility by default. Every agent is logged. Every run is a trace. Every action is readable, live, without any instrumentation work.
You do not need to build a monitoring layer. You just need to look.
Frequently asked questions
What is AI agent observability?
AI agent observability is the practice of monitoring, tracing, and logging everything an AI agent does during a run: which tools it called, what decisions it made, how many tokens it consumed, and whether it completed its goal. Unlike traditional software monitoring, it must account for non-deterministic, model-driven behavior where errors often appear as wrong outputs rather than thrown exceptions.
How is AI agent observability different from traditional monitoring?
Traditional monitoring tools like Datadog or Sentry are designed for deterministic systems where errors produce exceptions and code paths are predictable. AI agents are non-deterministic: they can fail silently by producing wrong outputs, hallucinate data, or loop through tool calls without throwing any errors. Observability for agents requires tracing reasoning steps and tool calls, not just catching HTTP status codes.
What metrics should I track for AI agents?
At minimum: token usage per run, run count over time, error rate, average run duration, tool call frequency, and human escalation rate. More advanced teams also track cost per successful outcome (not just per run), semantic drift over time, and retry rate. High retry rates are a reliable early signal of model confusion or broken tool inputs.
How does Rerun provide observability for AI agents?
Rerun logs every agent action automatically, with timestamps, token counts, and tool inputs/outputs. The builder view shows a live Logs tab and a To Handle tab for pending escalations. The Monitoring section shows cost and run count over 24h, 7d, 30d, and 90d windows. Dashboard widgets can surface this data across multiple agents at once, and dashboards can be published as public links for stakeholder visibility.
Can I debug AI agents in real time without writing code?
Yes. On Rerun, every agent run is logged and displayed in a readable Logs tab without any instrumentation code. You open the builder, trigger a run, and watch each action appear in real time, including tool inputs and outputs. No SDKs, no custom logging setup, no configuration required.
What causes most AI agent failures in production?
The most common failure patterns are: tool call loops (the agent retries the same tool repeatedly), context overflow (the model forgets earlier steps as context grows), silent wrong outputs (the agent finishes but produces incorrect results), confidence hallucination (the model fills in missing values with plausible but false data), and escalation fatigue (operators stop reviewing agent escalations because they happen too often).
Do I need a separate observability tool for Rerun agents?
No. Rerun has built-in observability out of the box: every agent is logged by default, and dashboard widgets surface metrics, logs, and escalations without any third-party integration. You can publish your dashboard as a public link for stakeholder or client visibility without exposing agent configuration.

Written by
Clément Janssens